

The Perils of Performance Analysis
Measuring performance in the investment business is absolutely necessary. But far too often, evaluating performance itself causes investors to make wealth destroying decisions. This is a phenomenon I’ve witnessed throughout my career.
Consider the issue ofwhat time-frame investments should be measured over. In the world of marketable securities, you can actually measure your investment performance by the second during active trading hours. Is this really necessary? I think most people would agree that it is not, but amazingly, there are a ton of investors who do look at their investments daily.
Most people recognize that the shorter the time-frame you evaluate, the more likely it becomes that you’re just looking at “noise” and randomness. But it gets tougher to separate the signal from the noise when you start viewing longer time periods such as quarters or years.
One of my favorite Warren Buffett quotes is as follows: “A rising tide lifts all ships. But its only when the tide goes out that you see who’s been swimming naked.” Another way to put it is, when markets are moving up (which can go on for years), it becomes very hard to distinguish talent from luck. It’s usually only after trends reverse and things cycle through that you can confidently determine who had a sound strategy and who was just riding a hot asset.
History, of-course, is full of good examples. One of the best happens to involve Warren Buffett and his company, Berkshire Hathaway. Imagine you had read about Buffett in the mid-1990s and were impressed with his strategy. Recognizing he had already built perhaps the best investment record in history, you decided to buy one share of class A stock in his company. The following shows the price of Berkshire stock and the levels of the S&P500 and NASDAQ Composite[1] at the market close on 12/31/1996:[2]
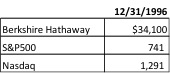
At the time of your purchase, little did you (or anyone else for that matter) know that US stocks were in the first half of one of the greatest market rallies in history. Most people would assume that if the market generally was moving up, so too would Berkshire Hathaway stock. Though Berkshire’s stock did gain in value, its performance dramatically lagged the big US indices particularly in the latter years of the rally. When the markets finally peaked in March of 2000, here were the results:[3]
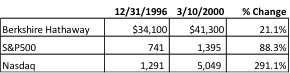
Anyone looking at these performance figures in a vacuum would assume something had gone wrong at Berkshire Hathaway. But the reality was, nothing had really changed at all. Buffett was doing the same thing he always did, looking for good companies at low prices.
What had changed was market psychology. The internet craze was well underway as was a general euphoria for large-cap US stocks. If you were a money manager without (or with limited) exposure to technology or large-cap stocks in the late 1990s, you underperformed, and you probably lost a lot of clients who left to chase “hot” funds.
Consider this, in 1999, the stock price of Berkshire Hathaway declined by 19.86%. Meanwhile the S&P500 increased nearly 20% and the NASDAQ was up over 85%! Ask yourself, would you have the conviction to stick with an investment manager who underperformed (on a relative basis) by 40% in one year?
The reality is that the vast majority of individual investors do not have this conviction. And amazingly, institutional investors don’t seem to be any better. I was recently told of a study that showed the number one determining factor of institutional fund flows (a measure of where money is going to and from) was the past year’s performance. The investment funds with the best past year’s performance got the most new money and the funds with the worst 365 day performance saw the most money leave. In other words, managers of pensions, endowments and other institutions seem to chase yesterday’s returns just as much as retail investors.
Intuitively this may make sense. “I’m going to sell my losers and add to my winners.” The problem is, investing in what was good yesterday doesn’t do you a darn bit of good. Today, you want to invest in what’s going to be good tomorrow. Remember the old saying, “buy-low, sell high?” Chasing winners tends to result in the opposite; buying assets that have moved up to unattractive price levels.
Let’s look back to our Berkshire example. Say you did decide to sell your “loser” in March of 2000 and reinvested into an S&P500 and NASDAQ index fund. Here are the results[4] since that time:
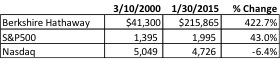
The numbers are staggering. They are dramatic because the timing of the change would have been so horrendous, and Warren Buffett’s skills as an investor and businessman have proved superior over time.
What’s particularly unfortunate is when markets move to excessive levels (both on the upside and downside), this is where we tend to see investors make the most dramatic changes to their holdings which can amplify the impact of a bad decision (because they are usually buying high and selling low).
I personally think the best time-frame to measure investment strategies over is entire market cycle. I would define this as the bottom of a bear market to the bottom of the next bear market or top of a bull to the next top. I maintain this view because, as we’ve discussed, in any given year, or multi-year bull market, temporary trends can make even the most sound strategy look out-of-step.
If a specific asset is hot and you have limited or no exposure to it, you’re going to underperform on a relative basis. The problem isno one can pick which asset class is going to be the best in any given year. This is an incredibly important point, especially considering that the S&P500 has been on a roll in recent years.
Since December, investors across the United States have been grumbling that they’ve underperformed this major benchmark over the last year or two. Doubling this effect is the fact that the media basically only reports on three major benchmarks: The Dow Jones Industrial Average, the S&P500 and NASDAQ Composite, all of which overlap to some degree. The trouble is most investors have diversification far beyond these popular benchmarks which makes them come up short for evaluating performance.
In 2014, we saw a lot of divergence in equity markets. The S&P500 index, representing the stocks of the five-hundred largest companies in the United States, was up approximately 13.7%. Oddly though, the Russell 2000 index, representing the stocks of two-thousand small US based companies was only up 4.9%. International stocks, represented by the MSCI EAFE index, were actuallynegative 4.5%.
I’ve had a number of people ask me, “Why not just invest in the S&P500?” It’s a fair question and the answer is simple. The S&P500 is not the best asset to own every single year, or even in the majority of years. To emphasize this point, let me share several examples where specific asset classes have significantly out-performed the S&P500 over multiple years: [5]
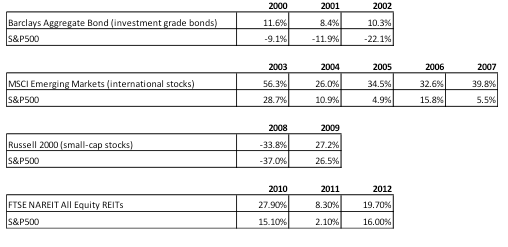
The numbers speak for themselves. Investors only owning the S&P500 over the past 15 years would potentially have left a lot of money on the table. But as you’ll notice from this small sample, no asset performs the best every year. This is one reason for diversification.
As you can see, measuring performance can be a very tricky endeavor. The paradox of the whole concept is, in an effort to make more intelligent decisions, you can end up making worse decisions if you don’t know what you’re doing.
There’s a famous ongoing study by a firm called Dalber. Over the years this firm has studied the effects of investor behavior on returns. In 2014, the firm reported its 20th year of results, and basically they’ve been the same since the very beginning.[6] On average, retail investors significantly underperform the major indices year after year. The researchers concluded very early on, and their conclusion hasn’t changed over the years, that the severe underperformance is basically the result of chasing returns. I’m of the view that looking at short-term performance numbers is the leading cause for this ongoing phenomenon.
It is absolutely imperative to remember that short-term measures are extremely subject to randomness and unsustainable trends. Investors are much better served by evaluating results over an entire market cycle. This highly increases the odds of identifying which strategies are sound compared with those that just “rise with the tide.”
Additionally, investors need to be careful with benchmarks. The most commonly cited stock indices on the evening news only represent the largest publicly traded companies in the US (we didn’t discuss this but the Dow Jones Industrial Average only tracks 30 stocks). Chances are good that your portfolio has exposure to many other assets that are not going to always neatly track with these popular indices. The result is, comparing your portfolio to the S&P500 or DJIA exclusively isn’t going to give you the best information to make an informed decision.
As you review your investments now and in the future, remember these important issues. The recommendations are in no way perfect. Market cycles vary in duration and waiting for one to play out as you analyze a strategy subjects you to opportunity cost. Likewise, no benchmark will ever be perfect. These are the realities that investors must face, but generally speaking, measuring longer term performance and understanding the short-comings of specific benchmarks will provide you much greater context as you analyze your investments.
[1] The S&P 500, or the Standard & Poor's 500, is an American stock market index based on the market capitalizations of 500 large companies having common stock listed on the NYSE or NASDAQ. The NASDAQ Composite is a stock market index of the common stocks and similar securities (e.g. ADRs, tracking stocks, limited partnership interests) listed on the NASDAQ stock market, meaning that it has over 3,000 components. It is highly followed in the U.S. as an indicator of the performance of stocks of technology companies and growth companies.
[2] Historical pricing data source: http://finance.yahoo.com/
[3] Results do not include dividends.
[4] Results do not include dividends.
[5] JP Morgan Asset Management: Guide to the Markets. https://www.jpmorganfunds.com/
[6] Dalbar Study 2014 Results: http://www.forbes.com/sites/advisor/2014/04/24/why-the-average-investors-investment-return-is-so-low/