

Blackjack
I read an excellent autobiography this summer by Edward Thorp which I also mentioned in our most recent newsletter. Mr. Thorp’s name is much less known in contrast to his accomplishments. He is a mathematician by training, obtaining his Ph.D. from UCLA. He’s popularly known for a number of feats. The one that clearly stands above them all is his creation of the card counting system popularly used in blackjack. I’d highly recommend reading Thorp’s autobiography if you’re interested in an incredible life story that, in my opinion, could be made into a movie.
In addition to developing the card counting system that gamblers still use today, Thorp, along with another legendary professor, Claude Shannon, created what is now considered to be the first “wearable” computer. They built the computer to aid them in predicting roulette and tested it with great success in Las Vegas. Not wanting to spend all of their time in smoky casinos trying to avoid detection, Thorp and Shannon moved on to other things with the satisfaction of knowing they could beat the game.
Thorp went on to experience tremendous success on Wall Street. He is largely considered the father of quantitative investing strategies which use statistics and algorithms to make buy/sell decisions. At various points in his autobiography, Thorp compares investing to gambling because of the obvious parallels. One thing that struck me, and seems especially relevant today, is his description of actual blackjack play.
If you play blackjack “perfectly” without counting cards, the dealer holds a slight advantage of around 0.5%. However, Thorp figured out that the odds change from hand-to-hand as cards are dealt from the deck. Counting cards is simply a way to track what has been dealt so-as to know what remains. The cards remaining undealt are what shift the odds either for or against the player thus making this information extraordinarily valuable. On the rare occasion when the odds become extremely favorable, you bet big. That is how you ultimately beat the dealer. The rest of the time, when the odds range from fair to negative, you make small bets in an effort to minimize losses. It’s important to recognize that the latter scenario is what card counters face in the majority of hands they play.
Investing is very much the same. Most of the time, investors face a market place where prices are fair to high, i.e., the odds are weak to negative. Thinking about the markets in these terms is helpful I think because it gets people away from looking at charts. The consequence of looking at long-range market charts is the illusion that cycles are predictable. The reality couldn’t be further from the truth.
As I’ve emphasized many times, I am aware of no one, all the legendary investors included, who made money by consistently predicting the general direction of the market. It is simply a losing strategy. Markets move much like blackjack play; the odds are constantly changing. The key thing to understand is that the movement of prices, like the undealt cards in blackjack, is what makes the odds vary. When prices are low, the odds are generally better than when they are high. This idea is especially relevant today as we’ve experienced a global
surge in asset prices. The situation reminds me of the card counter who is facing a remaining deck full of small cards (which is very unfavorable to the player).
Let me demonstrate how changing prices shift the odds. We’ll consider real estate because it tends to be easier to understand. Imagine a rental property that fetches $1,000 per month ($12k per year). If you could purchase the property for $150,000, it would be generating a rent yield of 8% ($12k/150k) before expenses. Now, let’s examine how rising prices would impact the economics of this property (assuming flat rents).
Since US stocks bottomed out in March of 2009, prices have risen by over three-fold as measured by the S&P500. Thus, we’ll look at how doubling and tripling the price of our hypothetical rental property changes things:
| Annual Rent | Property Price | Rent Yield | |
|---|---|---|---|
| $12,000 | $150,000 | 8.0% | |
| Prices Double | $12,000 | $300,000 | 4.0% |
| Prices Triple | $12,000 | $450,000 | 2.7% |
Notice how our rent yield compresses as prices rise. The economics of our property look worse and worse (i.e., the odds change). Another way to think about it is paying a high price erodes away any margin for error. Put another way, paying a high price increases risk because the slightest market blip or miscalculated assumption can be ruinous (many real estate investors learned this lesson when prices turned downward in 2007-2008). This is a critically important point to understand in the context of the current market environment.
A strategist I follow has regularly been updating the following table:
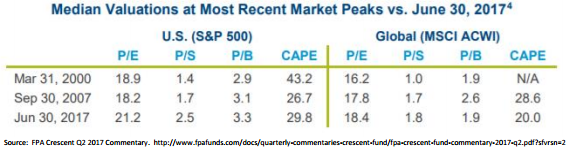
Without getting too far into the weeds, the table above highlights several fundamental measures of stock market valuation. The left side is highlighting US stocks represented by the S&P500; the right side is highlighting global stocks represented by the MSCI All Country World Index.
I don’t want to go too deep here so here’s all you really need to know. Take note of the dates listed on the far left hand side. They are significant because March of 2000 and September of 2007 correspond with the peaks of the previous two bull markets. The last row, of course, represents the present bull market. All you need to understand is that most of the valuation metrics shown here currently exceed those of the previous two market peaks.
But you have to be very careful with this data because expensive assets can get more expensive. In fact, that is exactly what’s happened over the course of the past several years. This is a classic example of why trying to play the timing game is futile.
These types of measures do nothing to tell us where things are headed over the next month or even year. It’s very akin to the card counter who knows the odds have shifted, but still lacks the ability to predict the next card. In this way, the game of blackjack and investing are very similar.
So what is one to make of the data in the table? Put simply, I view it as an indication that the odds in the current investing environment are poor. Prices are high and very few attractive opportunities exist. To adjust for this type of environment, I do two things, which I think are instructive for most investors. You may get a laugh (or cry) out of the first but it’s true; lower your expectations for future returns (at least in the medium term).
In our rental example above, you can see how poor the numbers look if you were to pay $450k for the property. The only way an investment like that really works out is if prices rise still further (so you can sell), or rents increase. The point is, one or both of those things has to happen for the investment to turn out favorable. I’m more interested in the first scenario where I’m generating 8% day one regardless of the other less certain variables. The greater point is that broadly high prices make the economics of most investments currently unattractive. At these levels, everything has to go right which means there is more risk.
The second thing I do is take a more cautious approach. Specifically, in an environment like we’re in, it is only prudent to be extra guarded and disciplined in your investment decisions. As a result, we continue to favor strategists who:
- Only invest in the highest quality businesses; and
- Are willing to accumulate and hold cash when attractive opportunities are not present.
A high-quality business can mean many things. The strategists we like generally define it as a company that:
- Uses little or no debt to finance its operations;
- Holds a dominate position in its industry or market; and
- Earns a higher than average return on its invested capital (borrowings + equity)
These are the kinds of businesses that you want to own when the world is full of risk, especially should we face another financial crisis. After all, it’s difficult for a business to become insolvent if it carries no debt.
Finally, I mentioned holding cash. I can’t emphasize enough that accumulating and holding cash is vastly different than trying to time the market cycle. We have zero confidence in anyone’s ability (including our own) to forecast the next correction (down 10%) or bear market (down >20%). Patiently waiting (sometimes for extended periods) for investment opportunities that exhibit favorable risk/reward characteristics is simply a prudent way to manage risk. This is not unlike the card counter who, after calculating poor odds, lowers his bets and plays conservatively until the game presents better probabilities. Just like in blackjack, sometimes you have to play through periods when the environment is unfavorable. That is precisely what investors face today. There are virtually no bargains to be had which makes risk levels considerably elevated. They say patience is a virtue, and that is definitely true in the current market.
With all this talk of blackjack, perhaps you’re ready to go to the casino. I’ve never had much objection to people gambling if it’s truly for entertainment purposes, but I ask just two things, and it’s really all you need to remember from this lengthy memo: In today’s investing environment of rapidly rising markets, the odds don’t appear favorable (much like the casino) for ongoing price appreciation. So enjoy the good fortune while it lasts, but in the medium term, lower your expectations and play conservatively.
Disclosure:
The opinions voiced in this material are for general information and are not intended to provide specific advice or recommendations for any individual. All performance is historical and is no guarantee of future results. All indices are unmanaged and may not be invested into directly.
No strategy assures success or protects against loss.
This is a hypothetical example and is not representative of any specific investment. Your results may vary.